

 Deutsch
 Français
 Türkçe
Service quality
Track open cases, resolution time and deadlines transparently.

Endurion Beacon connects approved sources to documented metrics. Definitions, checks and freshness come before visualisation, so reports make their provenance and limitations clear.
Displayed figures are illustrative assumptions, not evidence of customer project results.

Service and finance may count the same job differently. Beacon first makes the statuses, periods and exceptions behind each metric explicit. Retrieval, checks and approval are planned so outdated or incomplete data cannot masquerade as current certainty.
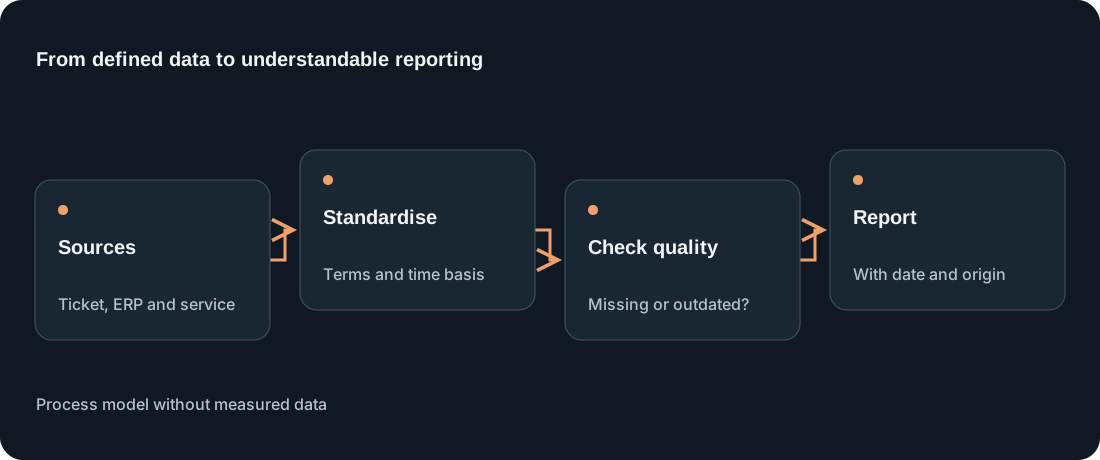
Swipe the diagram sideways. Full step descriptions follow below.
Identify ticket, ERP and service data with accountable owners.
Document statuses, periods, exclusions and calculations.
Flag missing values, stale refreshes and unexpected differences.
Deliver role-based views or scheduled exports with timestamps and provenance.
Reports with shared definitions, data timestamps and source references support decisions without embellishing findings with invented measurements.
Track open cases, resolution time and deadlines transparently.
Examine recurring work and bottlenecks using defined inputs.
Share approved metrics with source references and timestamps.
Illustrative scenario, not a customer reference or measured result.
A technical service manager receives figures from Excel, ticketing and ERP. Only in the weekly meeting does it emerge that teams count periods and statuses differently. Beacon starts with definitions and provenance.
Discuss your own workflowExport files, reconcile conflicting sheets, refresh charts and distribute reports without one consistent data cut.
Retrieve agreed sources, calculate metrics using documented rules, flag incomplete data and publish reviewed reports with timestamps and provenance.
SLA summaries, maintenance status, service volumes, open jobs and project progress backed by traceable sources.
From agreed sources and documented formulas. AI may draft commentary but must not generate measurements that cannot be traced to a source.
Ticketing such as ServiceNow or Jira, ERP, Excel, databases and APIs supply data. Power BI, SharePoint or scheduled exports are selected by user needs, available interfaces and licences.
Where statuses, periods and exceptions share definitions. Differences in SLA rules or data collection must remain visible.
A dashboard cannot repair incorrect source data. Metrics need approved definitions, and incomplete retrieval must remain visible. AI commentary may not invent values and must be distinguished from calculated results.
Not necessarily. Existing tools, audience, data paths and licences determine the output. A scheduled export may suit a limited need.
Endurion documents metric formulas, time boundaries, exceptions and data ownership. Validation and approval precede report distribution; presentation comes afterwards.
Checks cover required values, freshness and expected volumes. A failed retrieval is flagged and must not be released as a complete current report.
Change the assumptions. This models potential released capacity, not guaranteed savings or a quote.
Monthly volume × (current minutes − projected minutes) ÷ 60 = hours. Multiply by assumed hourly labor cost for illustrative time value. Implementation, licensing, review and operating costs are not deducted.
Use these answers to define technical prerequisites, remaining review work and the first project scope.
From agreed sources and documented formulas. AI may draft commentary but must not generate measurements that cannot be traced to a source.
Where statuses, periods and exceptions share definitions. Differences in SLA rules or data collection must remain visible.
Not necessarily. Existing tools, audience, data paths and licences determine the output. A scheduled export may suit a limited need.
Checks cover required values, freshness and expected volumes. A failed retrieval is flagged and must not be released as a complete current report.
Role filters, limited retention and business ownership are part of the data pipeline. AI-written commentary is separated from calculated metrics and labelled accordingly. Failed retrieval needs a visible error state.
More about implementationNot necessarily. We assess Microsoft 365, ERP and existing BI capability first.
Only when linked to defined metrics and verifiable sources, with AI comments clearly marked.
What counts as a closed case, which timestamp applies and how are late entries handled? Set these rules before the first report. Only then can periods or teams be compared meaningfully.
A missing data run must not look like a successful business day. Beacon must expose freshness and gaps. Trace unusual values back to their source and version changes to calculation rules.
Let us review your systems, input data and the smallest useful pilot. Final scope and integrations are agreed after discovery.